Monday, September 30, 2013

Unit_06_ The traditional approach to requirements-confusing-


The Traditional Approach to Requirements

Traditional and Object-Oriented Views of Activities and Use Cases Data Flow Diagrams Documentation of DFD Components Locations and Communication through NetworksLearning ObjectivesAfter reading this chapter, you should be able to: 

  • Explain how the traditional approach and the object-oriented approach differ when modeling the details of a use case
  • List the components of a traditional system and the symbols representing them on a data flow diagram 
  • Describe how data flow diagrams can show the system at various levels of abstraction
  • Develop data flow diagrams, data element definitions, data store definitions, and process descriptions
  • Develop tables to show the distribution of processing and data access across system locations.
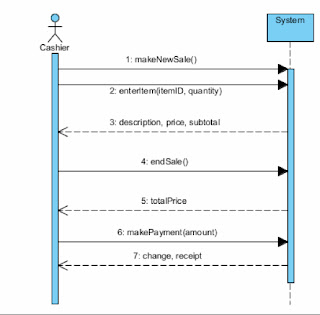
Traditional and Object-Oriented approaches do system development differ in how a system's response to an event is modeled and implemented. 

In this approach, entity-relationship diagrams represent things in the user's work domain. The Models that represent activities ( use-cases) and the interaction among activities and the things are very different from object-oriented models. Object-Oriented Activity models are more widely used than traditional models, these models are still used in many contexts, including documentation for older systems and to present requirements for new systems to users in an easy to read fashion. 

TRADITIONAL AND OBJECT-ORIENTED VIEWS OF ACTIVITIES AND USE CASES

The traditional approach views a system as a collection of processes.(some performed by people and some by computers)

Traditional computer processes are much like procedural computer programs; they contain instructions that execute in a sequence. 

When the process executes, it interacts with stored data reading data values and then writing other data values back to the data file.

The Traditional approach to the systems, then, involves processes, stored data, inputs and outputs and it includes processing models that emphasize these system features such as shown on the left side of the image. 

The Object-Oriented approach views a system as a collection of intersection objects. The objects are based on things in the problem domain. Objects are capable of behaviors(Methods) that allow them to interact with each other and with people using the system. There are no conventional computer processes, data files or databases per se. Objects carry out the activities and remember the data values. When modeling what the system does in response to an event, the Object-Oriented approach includes models that show objects, their behavior and their interactions with other objects. 
DATA FLOW DIAGRAMS
The traditional approach to information system development describes activities as process carried out by people or commuters. A graphical model that has been proven to be quite valuable for modeling process is the DATA FLOW DIAGRAM. {data flow diagram(DFD) a diagram that represents system requirements as process, external agents, data flows and data stores} The data flow diagram is graphical system model that shows all the main requirements for an information system in one diagram: inputs and outputs, process and data storage.
 DFD is easy to read because everyone working on a development project can see all aspects of the system working together at once. Also because is it a graphical model and because there are only 5 symbols to learn. End users, management, and all information systems workers can typically read in interpret the diagram with minimal training.  
[SQUARE]An External agent{a person or organization, outside the system boundary, that supplies data inputs or accepts data outputs.} 
[RECTANGLE WITH ROUNDED CORNERS] Process{a symbol that represents an algorithm or procedure by which data inputs are transformed into data outputs. }
[LINES WITH ARROWS] Data Flows { represents data movement among processes, data stores and external agents.}
[FLAT-OPENENDED RECTANGLE] Data Store { a place where data is held pending future access by one or more processes.}
Each data store represents an entity from the CSS entity-relationship-diagram. The data flow diagram shows the system use case in response to this one even in graphical form and integrates processing triggered by the event with the data entities modeled using the ERD.
DATA FLOW DIAGRAMS AND LEVELS OF ABSTRACTION
There are many different types of data flow diagrams produced to show system requirements. Other data flow diagrams show the processing at either a higher level( a more general view of the system) or at a lower level( a more detailed view of one process) These Differing views of the system, are called  LEVELS OF ABSTRACTION { any modeling technique that breaks the system into a hierarchal set of increasingly more detailed models.}
DFD's can show either higher-level or lower-level views of the system. The high-level processes on one DFD can be decomposed into separate lower-level, detailed DFD's. Process on the detailed DFDs can also be decomposed into additional diagrams to provide multiple levels of abstraction.
The image shows how at each level of detail, additional information is provided about one process at the next higher level. 
CONTEXT DIAGRAM
Context Diagram{a DFD that summarizes all processing activity within the system in a single process symbol.} 
A diagram that describes the most abstract view of a system. All external agents and all data flows into and out of the system are shown in this one diagram, with the entire system represented as one process.  The context diagram clearly shows the system boundary, the system scope is defined by what is represent with in the single process and what is represented as external agents. External agents that supply or receive data from the system are outside the system scope, and everything else is inside the system scope. This diagram does not usually show data stores because all the system's data stores are considered to be within the system scope. ( part of the internal implementation of the process that represents the system.) Data stores may be shown when they are shared by the system being modeled and another system. this diagram is usually created in parallel with the initial list of use cases and events. Each trigger for an external event become an input data flow and the source becomes and external agent. Each response becomes an output data flow and the destination becomes and external agent. triggers for temporal events are not data flows so there are no input data flows for temporal events in a context diagram
DTD FRAGMENT
{ represents the system response to one event within a single process symbol.} The fragment is created for each use case triggered by an event in the event table. each fragment is a self- contained model showing how the system responds to a single event. the analyst usually creates the fragments one at a time focusing attention on each part of the system. the fragments are drawn after the event table and context diagram are complete. The pictured fragments show details of interactions among the process, external agents, and internal data stores. the data stores used on a DFD fragment represent entities on the ERD. Each DFD fragment shows only those data stores that are actually needed to respond to the event. 
THE EVENT- PARTIONED SYSTEM MODEL
{ A DFD that models system requirements by using a single process for each event in a system or subsystem.} All the DFD fragments for a system or subsystem can be combined on a single DFD called the event-partitioned system model(diagram0). 
Diagram0 is used primarily as a presentation tool. It summarizes and entire system or subsystem in greater detail than a context diagram.
Reasons to Avoid diagram 0
The information context duplicates the set of DFD fragments. 
The diagram is often complex and unwieldy, particularly for large systems that respond to many events. 
Redundancy and complexity are two DFD characteristics that analysts should avoid whenever possible.
When a system responds to many events, it is commonly divided into subsystems, and a context diagram is created for each subsystem. The example illustrates a system divided into subsystems based on use case similarities, including interactions with external agents, interactions with data stores, and similarities in required processing. The next image shows the context diagram for the order-entry system.


Always remember that diagram 0 is used as a presentation aid. The DFD fragments show which process interact with which individual data stores. 
DECOMPOSITION TO SEE ONE ACTIVITY'S DETAIL
 Some DFD fragments involve a lot of processing that the analyst needs to explore in more detail. Further decomposition helps the analyst learn more about the requirements while also producing needed documentation. The diagram decomposes a process into four subprocesses. 
1. Record customer information
2.Record order 
3.process order transaction
4.produce confirmation
These subprocesses are viewed as the major four steps required to complete the activity. 


PHYSICAL AND LOGICAL DFDs
Physical DFD{ a DFD that includes one or more assumptions about implementation technology}
Logical DFD{ A DFD developed under the assumption of perfect internal technology}
Perfect Internal Technology{ an assumption that includes such technology capabilities as instant processing and data retrieval, infinite storage and network capacity, and a complete absence of errors}
A DFD can be a physical system model, a logical system model, or a blend of the two. In a physical DFD one or more assumptions about implementation technology will be embedded in the DFD. These assumptions can take many forms and might be very difficult to spot. A logical DGD is drawn as if the system might be implemented with any technology. One way that analysts develop logical DFDs is to assume that the system is implemented with perfect internal technology. Specifics of the assumption include process that never make mistakes, data stores that can hole unlimited amounts of data and flows and processes with infinite capacity and zero transmission time . All alternatives are described as possible, and if the model is a logical model, you should not be able to tell how the system is implemented.At the same time- the processing requirements should be fairly detailed down to indicating what attribute values are needed.
Inexperienced analysts often develop DFDs. The path to developing such a model is simple
Model everything the current system does exactly the way it does it. The problem with this approach is that design assumptions based on outdated technology limitations can become inadvertently embedded in the new system this problem is most prevalent when analysis and design are performed by different persons or teams. The designer may not realize that some of the requirements embedded in the DFDs are simply reflections of the way things were in the past, not the way they should be in the future. 
Physical DFDs are sometimes developed and used during the last stages of analysis or early stages of design. They are useful models for describing alternate implementations of a system prior to developing more detailed design models. Analysts should avoid creating physical DFDs during all analysis activities, except when generating design and implementation alternatives. Even during that activity, analysts should clearly label physical DFDs as such so readers know the model represents one possible implementation of the logical system requirements. 
EVALUATING DFD QUALITY
A high-quality set of DFDs is readable, is internally consistent and accurately represents system requirements. Accuracy of representation is determined primary by consulting users. A project team can ensure readability and internal consistency by applying a few  simple rules to DFD construction. Analysts can apply these rules while developing the DFDs or during a separate quality check after preparing DFD drafts. 
1. Minimizing Complexity. If to much information is presented at once someone may experience INFORMATION OVERLOAD{ difficulty in understanding that occurs when a reader receives to much information at one time.} The key in avoiding this is to divide information into small and relatively independent subsets. Each one should contain a comprehensible amount of information that people can examine and understand in isolation. The analyst can avoid information overload by following two simple rules of DFD construction
A. 7+/2
B. Interface Minimization
The 7+/2 rule( miller's number) shows that the number of information chunks that a person can remember and manipulate at one time varies between five and nine. 
a. a single DFD should have no more than 7 plus or minus 2 processes
b. no more than seven plus or minus two data flows should enter or leave a process, datastore or element on a single DFD
2. Minimization of interfaces{ a principle of model design that seeks simplicity by limiting the number of connections among model components} As with information chunks the number of connections that a person can remember and manipulate is limited. Process on a DFD represent chunks of business or processing logic. They are related to other processes, entities, and data stores by data flows. A single process with a large number of interfaces may be to complex to understand. An analyst can usually correct the problem by dividing the process into tow or more subprocesses each of which should have fewer interfaces. 
Pairs or groups of processes with a  large number of data flows between them are another violation in the interface minimization rule. The best division of work among processes is the simplest and the simplest division is on the requires the fewest interfaces among the processes. 
3.ENSURING DATA FLOW CONSISTENCY
An analyst can often detect errors and omissions in a set of DFDs by looking for specific types of inconsistency. Three consistency errors are 
1. Differences in data flow content between a process and its process decomposition.
2. Data outflows without corresponding data inflows
3. data inflows though corresponding outflows


     A process decomposition shows the internal details of a higher-level process in a more detailed form. In most cases the data content of flows to and from a process at one DFD level should be equivalent to the content of data flows to and from all processes in a decomposition. This equivalency is called Balancing{ equivalence of data content between data flows entering and leaving a process and data flows entering and leaving a process in decomposition DFD} , and the higher level DFD and the process decomposition DFD are said to be “in balance”
The term”data content” -data flow names can vary among DFD levels for a number of reasons, including the decomposition of one combined data flow into several smaller flows. The analyst must be careful to look at the components of data flows, and not just the names. Unbalanced DFDs may be acceptable when the imbalance is due to data flows that were ignored at the higher  levels. 
Another type of DFD inconsistency can occur between the data inflows and outflows of a single process or data store. By definition, a process transforms data inflows into data outflows. In a logical DFD data should not be needlessly passed into a process. 
a. All data that flows into a process must flow out of the process or be used to generate data that flows out of the process. 
b. All data that flows out of a process must  have flowed into the process or have been  generated from data that flowed into the process. 
A process or data store with a data input that is never used to produce data is called a BLACK HOLE. Another example is any process with at least one data inflow but no data outflows. 

Miracle{a process or data store with a data element that is created out of nothing}
Analysts can sometimes spot black holes and miracles simply by examining the DFD. 
Any data element that is read from a data store must have been previously written to that data store. Any data element that is written to a data store must eventually be read from the data store. 
Evaluating data flow consistency is a straightforward but tedious process. 
Without precise process descriptions it is impossible for the tool, to know what data elements are used as input or generated as output bu internal processing logic
DOCUMENTATION OF DFD COMPONENTS
Data flow diagrams graphically summarize interactions among three types of internal system components- processes, data flows, and data stores, but additional details about each component need to be described. First each lowest level process needs to be described in detail The analyst needs to define each data flow in terms of the data elements it contains. Data stores also need to be defined in terms of the data elements. Th analyst also needs to define each data element. 
PROCESS Descriptions

Each process on a DFD must be defined formally. There are several options for process definition. 
Process decomposition, as discussed a higher level process is formally defined by a DFD that contains lower level processes. These process may in turn be further decomposed into even lower level DFDs.
Eventually a point is reached at which a process does not need to be defined further by a DFD. This occurs when a process becomes so simple that it can be described adequately by two other methods: Structured english, decision tables or with decision trees. Each method, the process is described as an algorithm and an analyst chooses the most appropriate presentation format by determining which is most compare, readable, and unambiguous, 
STRUCTURED ENGLISH{  a method of writing process specifications that combines structured programming techniques with narrative english}
Uses brief statement to describe a process very carefully. It looks a bit like programming statement but without references to computer concepts. Rules of structured programming are followed and indentation is used for clarity. 
Structured English is well suited to describing process with many sequential processing steps and relatively simple control logic. Structured English is not well suited for describing processes with the following characteristics.
a. Complex decision logic.
b. Fer sequential processing steps.
Decision logic is complex when multiple decision variables and a large number of possible combinations of those variable ned to be considered.


Practice Quiz
Practice Quiz Unit_6
1.
The traditional approach to information systems development describes activities as ____.
A) processes carried out by people or computers 
2.
A(n) ____ represents the system response to one event.
A) DFD fragment 
3.
Which of the following data flow diagram (DFD) symbols represents the communication between an external agent and a process while the process is executing?
C) Real-time link 
4.
Which of the following is NOT a technique to document program logic for a process.
B) Decision Matrix 
5.
Analysts sometimes can spot black holes and miracles simply by examining the _________. 
C) data flow diagram 
6.
Which of the following is a table that describes the relationship between processes and the locations in which they are performed?
 C) Activity-location matrix 
7.
Which of the following is a diagram or map that identifies all of the processing locations of a system?
A) Location diagram 
8.
A ____ is a textual description of a data flow’s content and internal structure.
B) data flow definition 
9.
In small development projects, a(n) ____ may be a small loose-leaf notebook or word processing file.
B) data dictionary 
10.
A symbol on a data flow diagram (DFD) that represents an algorithm or procedure by which data inputs are transformed into data outputs is called a(n) ____.
A) process 


Saturday, September 21, 2013

Unit_5_ Extending_the_Requirements_Models


Unit_5_ Extending_the_Requirements_Models

Object-oriented techniques facilitate system-to-system interfaces by using predefined components and objects to accelerate the development process.
Object-oriented models track very closely with the new object-oriented programming languages and frameworks. All buttons on the screen, such as buttons, text boxes, and drop-down boxes are objects. Each has its own set of trigger events that activate its program functions. The way the business objects interact with each other in the use case determines how yo identify the initiating activity. We refer to those activities as the messages between objects. You need to think in terms of OBJCTS instead of just PROCESSES. It might help to think of yourself as an object, what functions and services are the other objects going to ask me to do ???
The Main objective of defining requirements in system development is understanding users' needs, how the business processes are carried out, and how the system will be used to support those business processes. System developers use a set of models to discover and understand the requirements for a new system. This activity is a key part of systems analysis and in the system development process. The first step in the process requires the fact-finding skills. These activities are also called DISCOVERY ACTIVITIES and discovery must precede understanding.

The models thus far focus on two primary aspect of functional requirements
1. The use cases
2. The things involved in users' work.
Use cases are identified by using the user goal technique and the event decomposition technique.
An information system also needs to record and store information about things involved in the business processes. In an automated system, the information is stored in electronic files or a database. The information storage requirements of a system are documented either with entity-relationship diagrams(ERDs) or with UML domain model class diagrams.

Use Case Descriptions
-> A textual model that lists and describes the processing details for a use case.
Implied in all use cases is a person who uses the system. In UML, that person is called an ACTOR,[Another way to think of an ACTOR  is as a ROLE] an actor is always outside the automation boundary of the system but may be part of the manual portion of the system. WHen we define actors that way, as those who interact with the system we can more precisely define the exact interactions to which the automated system must respond. This focus helps define the specific requirements of the automated system itself- to refine them as we move from the event table to the use case details.

Internally, a use case includes a whole sequence of steps to complete a business process. Several variations of the business steps exist within a single use case. The different flows of activities are called SCENARIOS  or sometimes USE CASE INSTANCES.A SCENARIO is a unique set of internal activities within a use case and represents a unique path through the use case.

BRIEF USE CASE DESCRIPTIONS
Depending on the needs, use case descriptions tend to be written at two separate levels of detail: brief description and fully developed description. A brief description can be used for very simple use cases.

FULLY DEVELOPED USE CASE DESCRIPTIONS
 The fully developed description is the most formal method for documenting a use case. Often there is a struggle to obtain a deep understanding of the users' needs. a fully developed use case description increases the probability that you thoroughly understand the business processes and the ways the system must support them.
A STANDARD TEMPLATE FOR DOCUMENTING A FULLY DEVELOPED USE CASE DESCRIPTION
1->2-> Identify the use cases and the scenarios within the use cases that are being documented. in more formal projects, a unique identifier can also be added for the use case, with an extension identifying the particular scenario. The name of the system developer who produced the form may also be added in this section.
3-> identifies the events that triggers the use case.
4-> a brief description of the use case or scenario. ( may just duplicate the brief description here)
5-> identifies the actor or actors.
6-> identifies other use cases and they way they are related to this use case. ( cross-references to other use cases help document all aspects of the users' requirements)
7-> identifies stakeholders who are interested parties other than specific actors. ( may be users who do not actually invoke the use case, but who have an interest in results produced from the use case) Considering all the stakeholders is important for system developers to ensure that thy have understood all requirements.
8->9-> Preconditions-and -Postconditions provide critical information about the state of the system before and after the use case executes. PRECONDITIONS ->  identify what the state of the system must be for the use case to begin, including what objects must already exist, what information must be available, and even the condition of the actor prior to beginning the use case.
POSTCONDITIONS-> identify what must be true upon completion of the use case. More Importantly !! they indicate what new objects are created or updated by the use case and how objects need to be associated. POSTCONDITIONS are important for two reasons!!!<<Indicate what to look for when stating the expected results for a test case and show the objects that will need to collaborate in the design>>
1. They form the basis for stating the expected results for test cases that will be used for testing the use case after it is implemented.
2. The objects in postconditions indicate which objects involved in the use case are important for design. ( design of a use case includes identifying and assigning responsibilities to objects that collaborate to complete the use case.)
10->>> Describes the detailed flow of activities of the use case.
11->> Alternative activities and exception conditions are described.( the numbering of exception conditions also helps tie the exceptions to specific steps in the flow of activities.

ACTIVITY DIAGRAMS FOR USE CASES
Another way to document a use case is with an ACTIVITY DIAGRAM We already know about activity diagrams as a flow of workflow diagram. We also know it is an easily understood diagram to document the workflows of the business processes. It is a standard UML diagram and also an effective technique to document the flow of activities for each use case. Sometimes, an activity diagram can take the place of the flow of activities section of a use case description, and sometimes, it is created to supplement the use case description. There are two swim lanes: one for the customer and one for the system. Activity Diagrams are helpful when the flow of activities for a use case is complex. The intent of the richer user experience becomes evident when the activity diagram shows the use case in context.

The System Sequence Diagram-Identifying Inputs and Outputs
In the object-oriented approach, the flow of information is achieved through sending messages either to and from actors or back and forth between internal objects.
SYSTEM SEQUENCE DIAGRAM(SSD)->> is used to describe this flow of information into and out of the automated system and documents the inputs and outputs and identifies the interaction between actors and the system.
INTERACTION DIAGRAM->>  Either a communication diagram or a sequence diagram that shows the interaction between objects.
In a use case diagram, the actor "uses" the system, but the emphasis in an SSD is on  how the actor"interacts" with the system by entering input data and receiving output data.
:SYSTEM:  is an object that represents the entire automated system.
in SSDs and all other interaction diagrams, analysts use object notation instead of class notation..
In object notation a  A BOX  refers to an Individual object, not the class of all similar objects. The notation is simply a RECTANGLE  with the name of the object underlined. The colon before the underlined class name is a frequently used part of the object notation. In an interaction diagram, the massages are sent and received by individual objects, not by a class. In an SSD the only object included is one representing the entire system
Beneath the actor and system, are vertical dashed lines called lifelines.
LIFELINE OR OBJECT LIFELINE->> is simply the extension of that object- either actor or object- during the use case.
The arrows between the lifelines represent the massages that are sent by the actor. Each arrow has an origin and a destination. The origin of the message is the actor or object that sends it, as indicated by the lifeline at the arrow's tail. The destination action or object of a message is indicated by the lifeline that is touched by the arrowhead. The purpose of lifelines is to indicate the sequence of the massages sent and received by the actor and object. The sequence of messages is read from top to bottom in the diagram.
A message is labeled to describe its purpose and any input data being sent. The message name should follow the VERB-NOUN syntax to make the purpose clear. The syntax of the massage has several options. In a sequence diagram, a message is an action that is invoked on the destination object much like a command. The input data that is sent with the massage is contained within parenthesis the syntax is simply the name of the massage flowed by the input parameters in parenthesis. this form of syntax is attached to a solid arrow.
The returned value has a slightly different format and meaning. A dashed arrow indicates a response or an answer, it immediately follows the initiating message. The format of the label is also different. Because it is a response, only the details sent on the response is noted.
A note can be added to any UML diagram to add explanations. The details of item information could also be documented in supporting narratives or even simply referenced.
Many times, the same message is sent multiple times.
NOTATION->> for same message sent multiple times->> a larger rectangle called  a LOOP FRAME->>notation on a sequence diagram showing repeating messages.
in a smaller rectangle at the top of the frame is the descriptive text to control the behavior of the messages within the larger rectangle. The condition loop for all items indicates that the messages in the box repeat many times or are associated with many instances.
ALTERNATE NOTATION
TTRUE/FALSE condition( boolean) Part of a message between objects that is evaluated prior to transmission to determine whether the message can be sent.
( Square brackets and text inside) The (*) asterisk preceding the true/false condition indicates that the message repeats as long as the true/false condition evaluates to true. many reasons to use this abbreviated notation..
1. a message and the returned data can be shown in one step. ( note that the return data is identified as a return value on the left side of an assignment operator - the:= sign. This simply shows a value that is returned
2. The true/false condition is used for the control of the loop. Thru/false conditions are also used to evaluate any type of test that determines whether a message is sent. An asterisk is placed on the message itself to indicate the message repeats. for simple repeating messages the alternate notation is shorter if several messages are included within the repeat for there are multiple messages- each with its own true/false condition- the loop frame is more explicit and precise.

COMPLETE NOTATION FOR A MESSAGE:
[true/false condition] return-value:=message-name(parameter-list)
(*) An asterisk  indicates repeating or looping of the message
[] Brackets indicate a true/false condition. This is a test for that message only. If it evaluates to true, the message is sent. If it evaluates to false, the message is not sent.
+ Message-name is in the description of the requested service. It is omitted on dashed-line return messages, which only show the return data parameters.
+ parameter-list ( with parenthesis on initiating messages and without parenthesis on returning messages) shows the data that are passed with the message.
+ Return-value on the same line as the message ( requires:=) is used to describe data being returned from the destination object to the source object in response to the message.

Sequence diagrams use two additional frames to depict processing logic.
OPT FRAME->> notation on a sequence diagram showing optional messages
ALT FRAME->> notation on a sequence diagram showing if-then-else logic.

DEVELOPING A SYSTEM SEQUENCE DIAGRAM(SSD)
  An SSD is usually used in conjunction with the use case descriptions to help document the details of a single use case or scenario within a use case. To develop an SSD it is useful to have a detailed description of the use-case either in the fully developed form or as an activity diagram. These two models identify the flow of activities within a use case, but they don't explicitly identify the inputs and outputs. An SSD will provide this explicit identification of inputs and outputs. One advantage of using activity diagrams is that is it easy to identify when an input or output occurs. Inputs and outputs occur whenever an arrow in an activity diagram goes from an external actor to the computer system.
 The development of an SSD based on an activity diagram falls into four steps:
1. Identify the input messages.
2. Describe the message from the external actor to the system by using the message notation. (describes the service requested from the system and the input parameters being passed)The important principle for identifying data parameters is to base it on the class diagram. The appropriate attributes from the classes are listed as parameters
3. Identify and add any special conditions on the input messages, including iteration and true/false conditions.
4. Identify and add the output return messages- Remember there are two options for showing return information: as a return value on the message itself or as a separate return message with a sashed arrow. There is no standard rule that when a transition arrow in the workflow goes from the system to an external actor an output always occurs. ( note they may be named with a noun that indicates what is being returned)

Remember that the object is discovery and understanding so you should work closely with users to define exactly how the workflow proceeds and exactly what information needs to be passed in and provided s output. This is an iterative process and you will need to refine the diagrams several times before they can accurately reflect the needs of the users.
We now know the models that are used in object-oriented development to specify the processing aspects of the new system. The use case descriptions as provided by written narratives or activity diagrams give the details fo the internal steps within each use case. Precondition and postcondition statements help define the context for the use case-what must exist before and after processing. The SSD describes the inputs and outputs that occur within a use case. These models provide a comprehensive description of the system-processing requirements and give the foundation for system design.

THE STATE MACHINE DIAGRAM- IDENTIFYING OBJECT BEHAVIOR
It is important for a computer system to maintain information about the status of problem domain objects. When defining requirements, analysts need to identify and document which domain objects require status checking and which business rules determine valid status conditions.
The status condition for a real-world object is ofter referred to as the STATE of the object. A more precede definition->> a STATE of an object is a condition that occurs during its life when it satisfies some criterion, performs some action, or waits for an event. OFr real-world objects, we equate the state of an object with its status condition.
Naming convention for status conditions help us to identify valid STATES. A state might have a name of simple condition ( on or in repair) Other sates are more active with names consisting of gerunds, or verb phrases, such as being shipped or working. If you find yourself trying to use a noun to name a state, you probably have an incorrect idea about states or object classes. the name of a state shouldn't be an object( or noun); it should be something that describes the object( or noun) States are described as semipermanent conditions because external events can interrupt a state and cause the object to go to a new state.
An object remains in a state until some event causes it to move, or transition to another state. A transition, then is the movement of an object from one stat to another state. Transitioning is the mechanism that causes an object to leave a state and change to a new one. States are semipermanent because transitions interrupt them and cause them to end. Transitions are short in duration-compared with states- and they cannot be interrupted. The combination of states and transitions between states provides the mechanisms that analysts use to capture business rules.
STATE MACHINE DIAGRAM->>  a diagram showing the life of an object in states and transitions.
   A state machine diagram can be developed for any problem domain classes that have complex behavior or status conditions that need to be tracked. Not all classes will require a state machine diagram. If an object in the problem domain class does not have status conditions that must control the processing for that object, a state machine diagram is not necessary. ( sale would need one.. sale transaction does not) a sale transaction is created when the payment is made and then just sites there .. it doesn't need to track other conditions.
A state machine diagram is composed of ovals representing the states of an object and arrows representing the transitions. The starting point of a state machine diagram is a black dot, which is called a pseudostate. The first shape after the black dot is the first state of the pointer. A state is represented by a rectangle with rounded corners with the name of the state placed inside. After a transition begins, it runs to a completion by taking the object to the new state called the DESTINATION STATE.  a transition begins with an arrow from an ORIGINAL STATE -the state prior to the transition- to a destination state, and it is labeled with a string to describe the components of the transition.


TRANSITION LABEL SYNTAX
transition-name(parameters…)[guard-condition]/action-expression

The transition is like a trigger that fires or an event that occurs. the name should reflect the action of a triggering event. For the transition to fire, the guard must be true. The forward slash divides the firing mechanism from the actions or processes. ACTION-EXPRESSIONS indicate some process that must occur before the transition is completed and the object arrives in the destination state.
The transition-name is then name of a message event that triggers the transition and causes the object to leave the origin state. Transitions are caused by messages coming to the object. The parameter portion of the massage name comes directly from the message parameters.
GUARD-CONDITION->> is a qualifier or test on the transition, and it is simply a true/false ( boolean) condition that must be satisfied before the transition can fire. OFr a transition to fire, first the trigger must occur and then the guard must evaluate to true. A transition has only a guard-condition and not triggering event and if this is the case-- the trigger is constantly firing and whenever the guard becomes true, the transition occurs.
Remember that messages have a similar test,(boolean) which is called a true/false condition. This true/false condition( boolean) is a test on the sending side of the message, and before a message can be sent, the true/false(boolean) condition must be true. In contrast, the guard-condition is on the receiving side of the message. The message may be received, but the transition fires only if the guard-condition is also true. This combination of tests, messages, and transitions provides flexibility in defining complex behavior.
The action-expression is a procedural expression that executes when the transition fires. It describes the action to be performed. Any of the three components-transition-name, guard-condition, or action-expression- may be empty. If either the transition-name or the guard-condition is empty, it automatically evaluates to true. Either of them may also be complex, with AND  and OR connectives.
COMPOSITE STATES AND CONCURRENCY
Another type of state :A composite state->>a state containing other states and transitions(that is,a path.) In the real world, it is very common for an object to be in multiple states at the same time. The condition of being in more than one state at a time is called Concurrency, or COncurrent States. The way we show this is with a synchronization bar and concurrent paths, as in activity diagrams. We could split a transition with a synchronization bar so one path goes to one state and the other path goes to other states. A PATH i->> is a sequential set of connected states and transitions.


Sample composite states for the printer object

The other way to show concurrent states is to have states nested inside other, higher level states. The higher level states are called-<<< COMPOSITE STATES-->> A composite state represents a higher level of abstraction an can contain nested states and transition paths. Example->>>When the printer enters the ON state, it automatically begins at the nested black dot and moves to the IDLE state. The printer is in the ON and IDLE states. When the print message is received, the printer makes the transition to the WORKING state but also remains in the ON state.. NEW Notation--->>>the lower compartment contains the action-expression- ->> the activities that occur while the printer is in the WORKING state.
We extend this idea of composite states and concurrency one step further by allowing multiple paths within a composite state. Perhaps an object has entire sets of states and transitions-multiple paths- that are active concurrently. To document concurrent multiple paths for a single object, we draw a composite state with the lower portion divided into multiple compartments-- one for each concurrent path of behavior.
EXAMPLE[a printer that has an input bin to hold the paper. This printer also alternates between two states in its work cycle: IDLE and WORKING. We want to describe two separate paths: one representing the state of the input paper tray
and the other the state of the printing mechanism. The first path will have the states EMPTY,FULL, and LOW. The second path will have the states IDLE and WORKING. These two paths are independent; the movement between states in one compartment is completely independent of the movement between states in the other compartment. The two ways to document this concurrent behavior, Synchronization bar(becoming three paths) or a composite state.
Concurrent paths for a printer in the ON state
In the example, the upper concurrent path represents the paper tray part of the printer. the two paths are completely independent, and the printer moves through the states and transitions in each path independently. when the OFF button is pushed the printer leaves the ON state. When the printer leaves the ON state it also leaves all the paths in the nested states. It does not matter whether the printer is in a state or in the middle of a transition. When the OFF button is pushed all activity is stopped and the printer exits.the ON state.

Rules for Developing State Machine Diagrams.
State machine diagram development follows a set of rules. The rules help develop State Machine Diagrams for classes in the problem domain. The primary challenge in building a state machine diagram ->>to identify the right states for the object. Again think of yourself. pretend that you are the object. How did I come into existence? What states am I in.. If you can think this way you will be able to develop state machine diagrams.
Difficulty also abounds in the area of identifying and handling composite states in nested threads. The primary cause of the difficulty is a lack of experience in thinking about concurrent behavior. Always remember that developing a state machine diagram, is an iterative behavior. more so than developing any other type of diagram. Analysts seldom get a state machine diagram right the first time. It takes many times to get it right. When you are defining requirements you are only getting a general idea of the behavior of an object. During design we build detailed sequence diagrams, and will refine and correct important state machine diagrams.
!!-->> Ask about exception condition--especially when you see the words VERIFY  or CHECK There will most times, be two transitions out of states that verify something.. 1:Acceptance
2: Rejection

STEPS TO GET STARTED IN DEVELOPING STATE MACHINE DIAGRAMS

1. REVIEW THE CLASS DIAGRAM AND SELECT THE CLASSES THAT MIGHT REQUIRE STATE MACHINE DIAGRAMS--> Remember to include only those classes that have multiple status conditions that are important for the system to track. Begin with the classes that appear to have the simplest machine diagrams.

2. FOR EACH SELECTED CLASS IN THE GROUP, MAKE A LIST OF ALL THE STATUS CONDITIONS YOU CAN IDENTIFY-->> Brainstorm!!! If in a team Brainstorm with the team.. The states Must reflect the states for the real-world objects that will be represented in software.. Think of the physical object, identify states of the physical object and then translate those that are appropriate into corresponding system states or status conditions. Think of the life of the Object, how does it come into existence in the system, when and how is it deleted from the system.. does have active states--inactive states?? states in which it is waiting. Think of activities done to the object of by the object. The object may be in a particular state as these actions are occurring.

3. BEGIN BUILDING STATE MACHINE DIAGRAM FRAGMENTS BY IDENTIFYING THE TRANSITIONS THAT CAUSE AN OBJECT TO LEAVE THE IDENTIFIED STATE-->>  [Example] a sale is in a state of READY TO BE SHIPPED a transition such as beginShipping will cause the sale to leave that state.

4. SEQUENCE THESE STATE-TRANSITION  COMBINATIONS IN THE CORRECT ORDER -->> Then aggregate these combinations into larger fragments. As the fragments are being aggregated into larger paths. Look for a natural life cycle for the object. build longer paths in the state machine diagram by combining the fragments.

5. REVIEW THE PATHS AND LOOK FOR INDEPENDENT, CONCURRENT PATHS -->> When an item can be in two states concurrently, there are two possibilities. The two states may be on independent paths, This occurs when the states and paths are independent, and one can change without affecting the other. One state may be a composite state, so the two states should be nested. A way to identify a candidate for a composite state is to determine whether its is a concurrent with several other states and whether these other states depend on the original state [Example] The ON state has several other states and paths that can occur while the printer is in the ON state, those states depend on the printer being in the ON state.

6. LOOK FOR ADDITIONAL TRANSITIONS->>  During a first iterations, several of the possible combinations of state- transition-state are missed. Take every paired combination of states and ask whether there is a valid transition between the states, Test for transitions in both directions.

7. EXPAND EACH TRANSITION WITH THE APPROPRIATE MESSAGE EVENT, GUARD-CONDITION, AND ACTION-EXPRESSION->> Include with each state appropriate action-expressions. This work may have been done as the state machine diagram fragments were being built.
8. REVIEW AND TEST EACH STATE MACHINE DIAGRAM->>
[A] Make sure your states are REALLY states of the object in the class. Ensure that the names of states truly describe the object's states rather than the Object itself
[B] Follow the life cycle of an object from its coming into existence to its being deleted from the system. Be sure all possible combinations are covered and that the patsy on the state  machine diagram are accurate.
[C] Be sure your diagram covers all exception conditions as well as the normal expected flow of behavior.
[D] Look again for concurrent behavior( multiple paths) and the possibility of nested paths( composite states).

DEVELOPING RMO STATE MACHINE DIAGRAMS.
->>Review the domain class diagram and then select the classes that have status condition that need to be tracked. [Sale and SaleItem classes] Other classes that are may be candidates for state machine diagrams are [inventoryItem, to track in-stock or out-of-stock items; Shipment, to track arrivals; and Customer, to track active and inactive customers.


SaleItem State Machine Diagram
1-> Identify the possible status conditions that might be of interest.
[a]Ready to be shipped
[b] On back order
[c]Shipped
 {The development of detailed models and diagrams is one of the most important activities that a system developer can perform. It forces analysts to ask fundamental questions, understanding the users' needs before writing the program always saves time}

2-> Identify exit transitions for each of the status conditions. The image showing the states that have been defined and the exit transitions for each of those states. A state has been added to the list -Newly added- which covers the condition that occurs when an item has been added to the sale but the sale isn't complete or paid for, so the item isn't ready for shipping.

3-> Combine the state-transition pairs into fragments and to build a state machine diagram with the states in correct sequence.
The Image illustrates the partially completed state machine diagram. The flow from beginning to end for the SaleItem is obvious. At least one transition is missing. There should be some path to allow entry into the ON back order state so we will recognize that this first-cut state machine diagram needs some fixing..

4-> Look for concurrent paths..In the example it doesn't appear that a SaleItem object can be in any two of the identified states at the same time.

5-> Look for additional transitions. 1st addition is to have a transition from Newly added to ON back order. to continue, examine every pair of states to see whether there are other possible combinations. look for backward transitions.
[a] can a SaleItem go from Ready to Ship to ON back order ( if there were not enough items in the warehouse and there should have been )
[b} Other backward loops, such as from Shipped to Ready to ship or from ON back order to Newly added would not make sense and are not included.

6->> Complete all the transition with correct names, guard conditions, and action-expressions. The first is the transition from the beginning black dot to the Newly added state. That transition causes the creation ( instantiation) of a new SaleItem object. It is give the same name as the message into the system that adds it: addItem(). The final transition is the one that causes the order item to be removed from the system. this transition goes from the Shipped state to a final circled black dot. this is a final pseudostate. On the assumption that it is archived to a backup-tape then it is deleted from the active system, that transition is named archive() .
Action=Expressions are added to the transitions to indicate any special action that is initiated by the order or on the object. [Example] Only one action is required. When an item that was Ready to hip moves to On back order, the system should initiate a new purchase order to the supplier to buy more items. . On the markBackOrdered() transition, an action-expression is noted to place a purchase order.

this image illustrates the final state machine diagram for SaleItem.
 7->> Reviewing and testing the state machine diagram- quality review step. a walkthrough is very appropriate.

DEVELOPING THE SALE STATE MACHINE DIAGRAM.
  The image shows the defined states and exit transitions that on first iteration appear to be required. the states describe the life cycle of a sale- [example] the status conditions.
1st the sale comes into existence and is ready to have items added to it .
2nd it goes to shipping and is in the IN shipping state.
Finally the Sale is Shipped and after the payment clears it is Closed.
3rd step fragments are built and combined to yield the first-cut state machine diagram
 The state machine diagram built from the fragments appears to be correct .. There are problems with the Waiting for back order state
InShipping and WaitingFOrBackOrders are concurrent states. Another state is needed ->BeingShipped, for when the shipping clerk is actively shipping items.
One way to show the life of a Sale is to put it in the INShipping state when the shipping begins. It also enters the BeingShipped state at that point. The sale can cycle between BeingSHipped and WaitingFor Back Order . The exit our of the composite state only occurs from the BeingShipped state which is inside the INSHipping state. Upon leaving the inside state the order leaves the composite INSHipping state..
3&4->> Note that new transitions must be added. The creation transition from the initial pseudostates is required. transitions must be included to show when items are being added and when they are being shipped. we put these looping activities on transitions that leave a state and return to the same state. We call this transition addItem() notice how it leaves the OpenForItemAdds state and returns to the same state. This is reflected in the Image
The benefit of developing a state machine diagram for a problem domain object is that it helps you capture and clarify business rules. From the state machine diagram, we can see that shipping cant commence while the sale is in the OpenFOrItemAdds state, new items cant be added to the sale after it has been placed in the ReadyFOrSHipping state, and the sale isn't considered shipped until all items are  shipped. If the sale has the status of INShipping we know that it is either actively being worked on or waiting for back orders.
the benefits of careful modeling help us gain a true understanding of the system requirements.

INTEGRATING REQUIREMENTS MODELS
 The domain model diagram is a special case. Much like the entire use case diagram, the domain model class diagram should be as complete as possible for the entire system [image below]
problem domain classes for the system provides and additional indicator of the total scope of the system Refinement and actual implementation of many classes will wait for later iterations. The domain model should be complete. The domain model is necessary to identify all the domain classes that are required in the new system. It is also used to design the database.
-> construction of a diagram depends on information provided by another diagram
-> development of a new diagram helps refine and correct a previous diagram
-> development of detailed diagrams is critical to gaining a through understanding of the user requirements.
The image shows the primary relationships among the requirements models for object-oriented development. the use case diagram and other diagrams on the left are used to capture the process of the new system the class diagram and its dependent diagrams capture information about the classes for the new system. The solid arrows represent major dependencies and the dashed arrows show minor dependencies. The dependencies generally flow from top to bottom, but some arrows have two heads to illustrate that influence goes in both directions. the use case diagram and the domain class diagram are the primary models from which others draw information..
They should be developed as completely as possible. Detailed descriptions provide important internal documentation of the use cases and must completely support the use case diagram. Such internal descriptions as preconditions and postconditions use information for development of system sequence diagrams, the detailed descriptions, activity diagrams and system sequence diagrams must all be consistent with regard to the steps or a particular use case. While you progress in developing the system and as you begin doing detailed system design, you will find that understanding the relationships among these models is an important element in the quality of your models.
SUMMARY
the object-oriented approach to information systems development has a complete set of diagrams and textual models that together document the users needs and define the system requirements. these requirements are specified by using domain model class diagrams and state machine diagrams to model the problem domain and use case diagrams, use case descriptions or activity diagrams, and system sequence diagrams (SSDs) to model the use cases. the internal activities of a use case are first described by an internal flow of activities. it is possible to have several different internal flows, which represent different scenarios of the same use case. Thus a use case may have several scenarios. These details are documented either in use case descriptions or with activity diagrams.
Another diagram that provides details of the use case's processing  requirements is an SSD . An SSD doormen's the inputs and outputs of the system the scope of each SSD is usually a use case or a scenario within a use case. The components of an SSD are the actor- the same actor is identified in the use case- and the system. The system is treated as a black box in that the internal processing is not addressed. Messages, which represent the inputs, are sent from the actor to the system. Output messages are returned from the system to the actor. the sequence of messages is indicated from top to bottom.
The domain model class diagram continues to be refined when defining requirements. the behavior of domain objects represented in the class diagram is an aspect of the requirements that is also studied and modeled. The state machine diagram is used to model object states and state transitions that occur in a use case. All the models discussed are interrelated and information in one model explains information in others.

The syntax of the message descriptor in a communication diagram is 
[true/false condition(boolean)] sequence-number:return-value:=message-name(parameter-list)

The transition Label consists of the following syntax with three components
transition-name(parameters,…)[guard-condition]/action-expression

practiceQuiz_05
A message event causes A TRANSITION TO FIRE.
In a transition label in a state machine the syntax is A(B)[C]/D. The D stands for ACTION-EXPRESSION.
A STATE MACHINE DIAGRAM documents information about classes that are part of the problem domain of the user. 
in a sequence diagram the message-name is given in VERB-NOUN format. 
In a sequence diagram the syntax of a message is given by the following:
[A]B:C(D) the Letter B represents RETURN VALUE
STATE CHART DIAGRAM is the best model to use to document the inputs and outputs to a system.
In a fully developed use case description normally the preconditions describe WHAT OBJECTS MUST EXIST PRIOR TO THE USE CASE EXECUTES.
Numbering exception conditions, which often uses hierarchal numbering, in a fully developed use case description is helpful to TIE THE EXCEPTION CONDITION TO A PROCESSING STEP.
Another way to think of an actor using a use is is as a ROLE
In a fully developed use case description the Exception Conditions represent WHAT CONDITIONS PREVENT THE SYSTEM FORM SUCCESSFULLY COMPLETING THE USE CASE.

Unit_5_Lab_Assignment
DeAnna Riddlespur
Professor Dave Busse
CIST 2921
Fall 2013
25 September 2013

Create a System Sequence Diagram (SSD) for this scenario involving a building supply company that has contractors for customers.

•    A contractor picks out his materials and takes them to a sales clerk
•    The sales clerk uses the system to look up the contractor by his name or id. The system displays the contractor’s information (name, address, etc)
•    The sales clerk then uses the system to create a sales ticket.
•    After the sales ticket is created by the system the sales clerk then adds each item number the contractor wished to purchase to the ticket one by one.
•    For each item added to the ticket the system returns the items description and price.
•    After the last item is added to the ticket the sales clerk then asks the system for the total sale, and the system displays the total.
•    The sales clerk then asks the system to print a receipt and the system prints a receipt, which ends the scenario.
My Analysis & Design Lab Assignment


1.
A single use case is described in depth by which models?
A) activity diagram
B) SSD
C) Fully developed use case description
D) None of the above
E) A, B, & C only
Correct Answer(s): E


2.
What is a condition that must be true before a use case begins?
A) trigger
B) postcondition
C) noun
D) precondition

Correct Answer(s): D


3.
Activity diagrams are not helpful when the flow of activities is too complex.
A) True
B) False

Correct Answer(s): False


4.
The ____ are the primary models from which other models draw information.
A) statechart diagram and the problem domain class diagram.
B) system sequence diagram and the activity diagram
C) use case diagram and the problem domain class diagram
D) use case description and the use case diagram

Correct Answer(s): C


5.
In a fully developed use case description the postcondition data describes what conditions?
A) The status condition of the use case.
B) The existence of domain model objects.
C) The condition of the actor.
D) The data that is output by the system.

Correct Answer(s): B


6.
Which are following must be true upon the successful completion of a use case?
A) trigger
B) postcondition
C) noun
D) precondition

Correct Answer(s): B


7.
What is the true about swimlanes and life lines as it relates to an activity diagram and/or SSDs?
A) Swimlanes are long rectangles and contain the activities which correspond to the actor or system
B) Swimlanes are found in pools.
C) Life lines are vertical dashed lines which also correspond to the actor or system
D) None of the above are True
E) A and C are True

Correct Answer(s): E


8.
________________ is a unique set of internal activities within a use case
A) Scenarios
B) Preconditions
C) Postconditions
D) Loop frames

Correct Answer(s): A


9.
In a system sequence diagram a box refers to a class of objects.
A) True
B) False

Correct Answer(s): False


10.
Two difference scenarios of a use case would normally be described in a single fully developed use case description.
A) True
B) False

Correct Answer(s): False